Growth-minded B2B executives struggle to understand frameworks that issue revenue-focused KPIs and OKRs to lead and coach marketing teams.
Often, marketing success is communicated through vanity metrics like page views, MQL creation, or social media engagement and these metrics don’t align with executives who focus on achieving revenue goals. This causes tension when revenue goals are not being met yet marketing teams are reporting success.
In this article, we’ll explore a framework that utilizes a custom-weighted (40:20:40) multi-touch attribution model to align marketing teams and executives with easy-to-understand revenue-focused KPIs.
6 keys to success
There is no perfect solution. No single attribute model or software program will solve all your attribution problems. To get everyone on the same page you must pick a model, understand the gaps, set some goals, and start executing.
To do this with the buy-in from your teams, it's important to communicate the gaps and benefits in the model to your stakeholders.
In the below example, I’m using Terminus’s attribution software in a custom weighted model (40:20:40) to create the data for these slides.
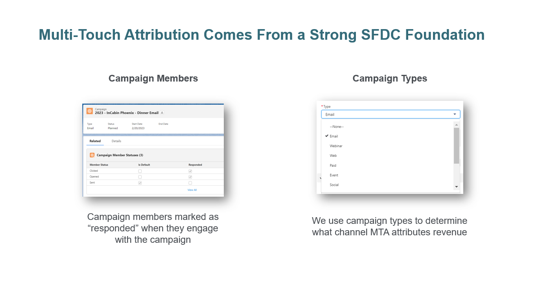
1. Explain how multi-touch attribution (MTA) works
I start by educating stakeholders about the fundamentals of MTA with these two operational points.
- These models use SFDC campaigns and member statuses that are marked as “responded” to identify what marketing activities are worthy of attribution.
- In SFDC, campaign types are used to identify the channels that receive attribution credit. For example, a campaign type of “SDR” will show attribution to the junior sales team, and “email” will give attribution to the email marketing programs.
This will show executives the importance that marketing operations play within the goal-setting process.
2. Explain how the Account-Centric MTA framework works
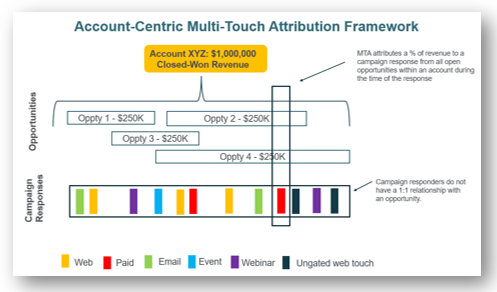
- The model uses the accounts closed-won value over the reporting time period. You can toggle between closed-won and pipeline within your MTA software.
- In most B2B cases there are many closed-won opportunities over the reporting period
- Retroactively, based on the applied model the MTA system applies a percentage allocation of all revenue from open opportunities within an account during the time of the response. We use a custom 40:20:40 model that applies 40% attribution to first touch, 20% attribution evenly across all middle touches, and 40% to the last touch.
3. Explain the gaps in the account-centric model
Campaign responses don’t have a 1:1 relationship with the closed-won opportunity.
This means if someone from Account ABC visits your booth at an event and they’re marked as a responder in the SFDC campaign, then that event will receive an attribution credit for all open opportunities during the time period.
This situation is not ideal because we don’t know if the campaign responder directly influenced the deal… maybe they did, maybe they didn’t.
Therefore, the account-centric model is best used to provide directional insight into marketing’s impact on revenue. This model should not be used as a first-touch or last-touch solution.
What’s important is that all stakeholders acknowledge this gap and become okay with the outcomes that this model provides because they’ll be directionally correct. This buy-in will create a foundation for revenue-focused KPIs.
4. Explain how the Opportunity-Centric MTA framework works
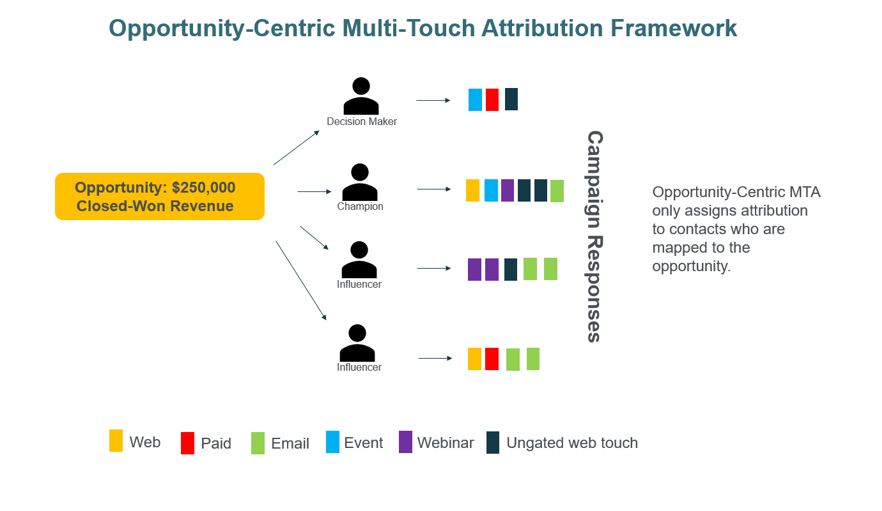
This is the preferred framework as it only assigns attribution to contacts that have been connected to a closed-won (or pipeline) opportunity.
This framework delivers higher model accuracy and provides a laser-focused view of marketing's impact on revenue and pipeline. However, the path to get here involves an increased data hygiene process, CRM automation, an advanced understanding of the MTA system, and buy-in from sales to keep CRM records updated.
When I explain the difference between these two frameworks, I start to get buy-in around the account-centric model because it’s in place now, and use the opportunity-centric model so stakeholders see what we’re working towards.
Usually, executives will see the opportunity-centric model as the preferred solution and accept the account-centric solution because you can start driving positive change from it now. You may even get additional resources to accelerate the path toward the opportunity-centric model!
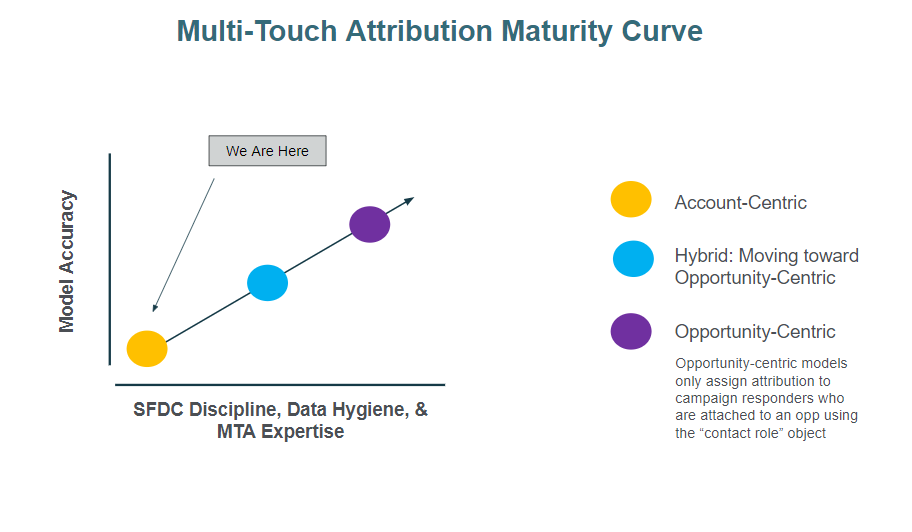
5. Explain where your company is on the MTA Maturity Curve
Visualizations help executives understand where they are today, and where they need to head towards.
The below slide should give more validation to accept the out of the box model account-centric model to set goals now!
6. Set revenue focused goals for marketing using MTA
Step 1: Establish a benchmark
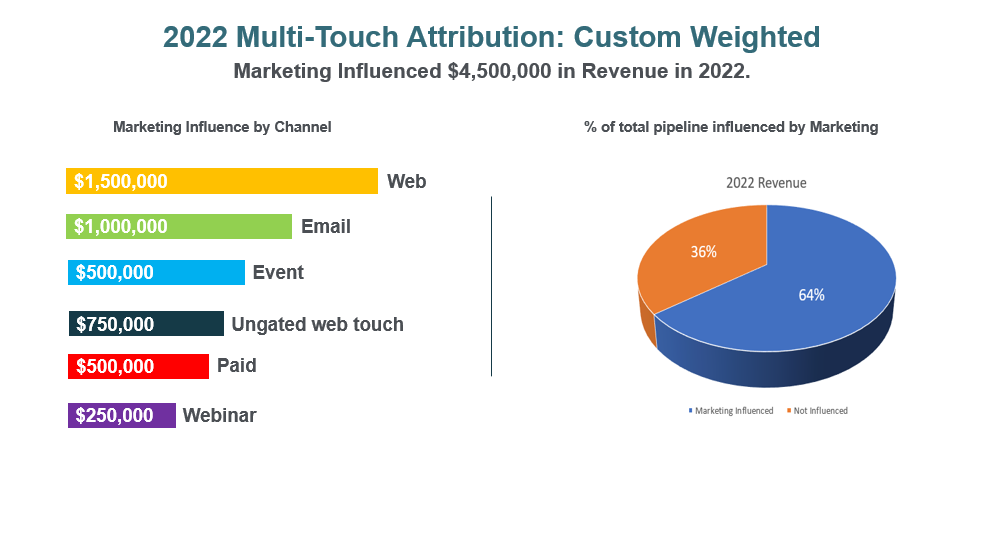
Go into your MTA software and pull a benchmark that shows your channel performance for the previous year. Also, identify the percentage of total revenue (or pipeline) that was influenced by marketing.
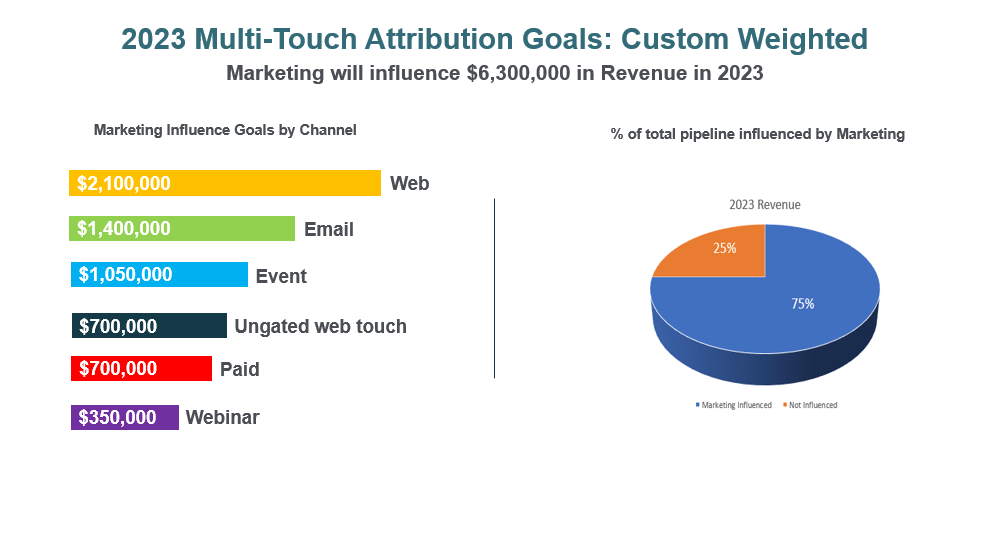
Step 2: Set MTA revenue goals for the year
Let’s say the company has a goal to increase YoY (year on year) revenue by 40%. Simply apply this increase to each channel's previous year's benchmark. Doing this will also increase the annual amount that marketing influences.
In addition to the increase in channel amounts, I also set a goal to increase the percentage of marketing-influenced revenue.
This is different from the above KPI. Let’s say your team influenced 75% of the total pipeline in 2022. You can achieve your pipeline growth goals of 40% YoY and still maintain the total amount of pipeline influence of 75%.
However, as the relationship between sales and marketing becomes stronger, the percentage of the influenced pipeline should also increase.
Step 3: Let your marketing team know what channels they’re responsible for work with them to set actions against the goals
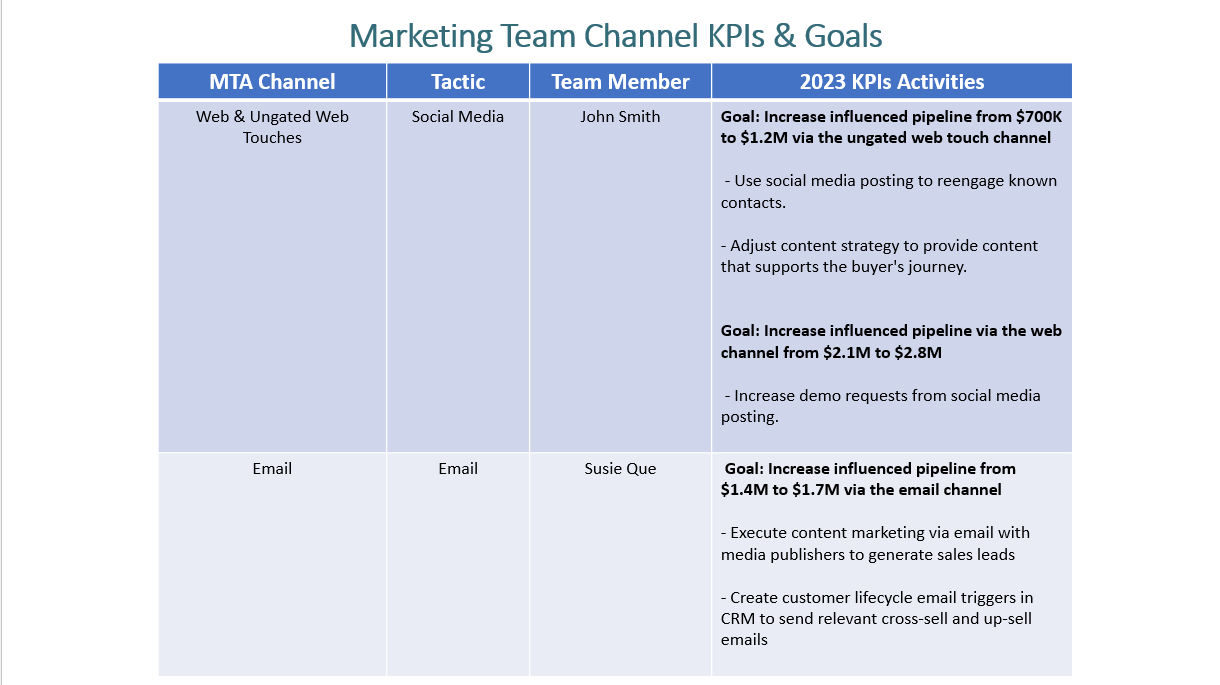
Every team member can relate the tactic (SEO, Social Media, PR, Events, Paid… etc) that they’re responsible for back to a channel within the MTA framework.
Remember, the main goal is to show progress toward revenue goals to executives and prevent vanity metrics from making their way to senior leadership.
This overall attribution method isn’t perfect and has gaps.
For example, if influenced revenue from ungated web touches goes up, we don’t have absolute confidence that social media is the driver. However, we do know that social media posting should drive clients and known prospects to our website site.
Therefore, if this channel increases in influenced revenue, we know that the social media team is producing content that’s engaging our target audience and impacting revenue.
Another example is if the ungated web touch channel increases, it’s a strong directional indicator that the content and social teams are moving in the right direction.
If the ungated web touch channel decreases then the opposite is true, we know there is something wrong with our social media strategy.
Because this channel's goal is not being met, we know our primary audiences (clients, known contacts, and active prospects) aren’t engaging with our web content, and social media posting is a primary driver of this.
Each tactic has its own directional relationship back to the measured channel.
Step 4: Report on progress towards goal
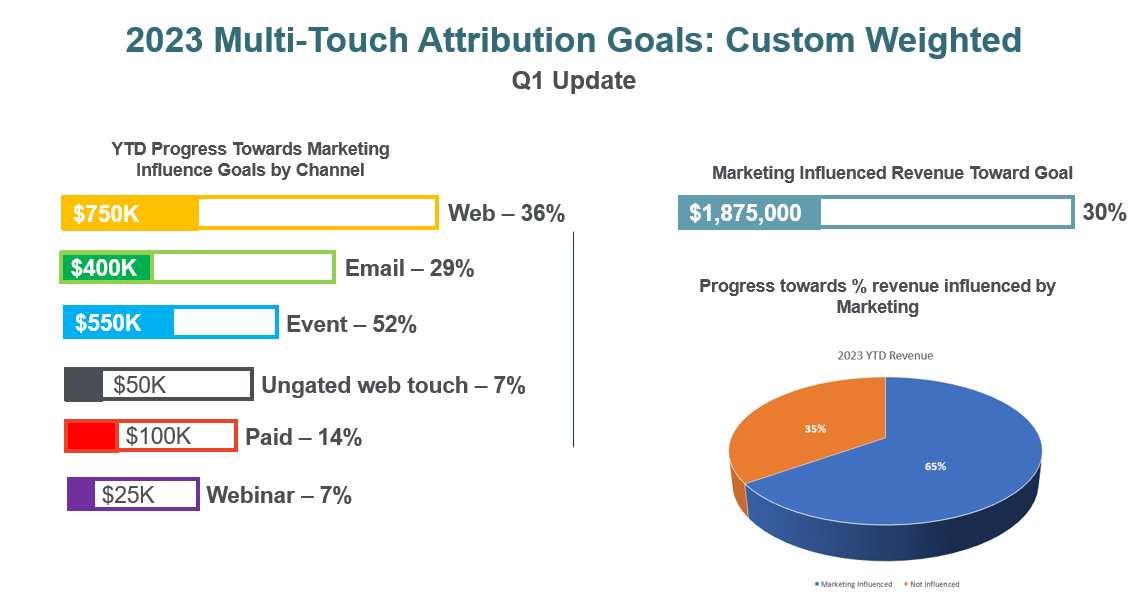
Each month or quarter (or both) update your report slide to show the progress toward your goals. Include the influenced amount for each channel and the percentage progress toward the annual goal.
Also, include the progress towards marketing's overall influenced revenue number and the percentage of influence on the total amount of revenue.
On a separate slide (not pictured), show the main marketing activities that were executed against each channel.
This reporting keeps executives updated on your team's progress toward revenue goals and showcases marketing’s impact on revenue.
Final thoughts
Most marketing teams are still using vanity metrics like page views and impressions as campaign KPIs. With this, executives struggle to understand marketing’s impact on revenue and provide meaningful revenue-focused goals for marketing teams to work toward.
Once stakeholders understand and accept the gaps that multi-touch attribution models can provide, a method can be presented that aligns teams and executives around the impact of marketing’s activities.
Psst... now's your chance to influence the most important conversations in revenue marketing
How do leading marketers drive growth? What channels attract and convert customers? Where should budgets be allocated? What metrics matter most?
Our groundbreaking 2024 Customer Acquisition and Marketing Attribution Survey will reveal the inner workings of today's state-of-the-art revenue engines. And you can help uncover the key insights.
The insights gained will be invaluable for staying ahead of rapid changes in 2024.
This is your exclusive opportunity to shed light on:
- Current marketing attribution models and challenges
- The evolving customer journey to purchase
- How teams track and optimize funnel performance
- Emerging strategies to connect with modern buyers
- Key focus areas for growth in 2024
… And a whole lot more.
Take the survey, and at the end, receive a comprehensive Customer Journey framework slide deck to help you and your team acquire more customers with less stress! 👇


Revenue marketing alliance insider
Thank you for subscribing
Level up your revenue marketing alliance career & network with revenue marketing alliance experts.
An email has been successfully sent to confirm your subscription.
 Follow us on LinkedIn